I’m frequently asked what metrics a security program should be collecting. The answer is complicated. It really depends on multiple factors, including but not limited to, what is important to upper management, what is the available data, and what type of questions are you trying to answer. These are things that can vary greatly from one org to another. Below is an attempt to put together a list of some of the metrics that should be broadly useful to at least a few orgs.
DEFINITION
First, we need to properly define a good metric. A good metric is one that is:
– Relevant. Every org is different, so stats that are vital to one business may have no meaning to another. Not every stat you can imagine or collect will actually matter to your boss. Have a clear set of questions that the numbers are trying to answer. A few very relevant metrics are a ton better than hundreds of irrelevant ones.
– Actionable. The metrics should be gathered in support of answering a specific question. The question should drive how the program proceeds. It should all fit into the security program’s plan. The metrics need to help management make decisions. The metric might be relevant but still be ambiguous; in such a case how the numbers are collected, analyzed, and visualized should be looked at to try to make the data more on point.
– Quantitative. It should have a distinct value. Labels like “High” and “Low” have their place, but are not concrete enough to measure over time. If it can’t be quantified down to a number, it is very hard to graph, compare, and build trends. Derive the qualitative ranking of “High” and “Low” from the numbers as a higher-order task.
– Easy to gather. If it takes your team longer to gather data for your weekly roll-ups than it does for them to actually analyze the incidents they are providing stats on, they are not focusing energy correctly. Standardize data as much as possible and automate collection and analysis as much as possible to reduce the pain required to produce the metrics.
– Consistent. One of the primary reasons for collection of metrics to build trends over time. If the data is not gathered consistently it will be impossible to accurately compare the numbers from one briefing to another and to build trend lines. For example, if you are trying to compare vulnerabilities found each month but each month you are scanning a different range of addresses, the data gathered will not accurately answer the question.
– Repeatable. Most metrics are going to be presented as snapshots (IDS alerts per day) at the tactical level, but will eventually be presented over time in order to show a trend line (plot each day’s volume of alerts in order to spot an increase in volume). The data collection should be as automated as possible and as painless for the team as possible. See Easy To Gather and Consistent.
Below is a collection of metrics that I have found useful in different settings. Not all of them apply in every environment. Consider this a menu that you can choose from. Implement them a few at a time in an order based on what is important in your org. Also, don’t constrain yourself just to this list; this is just a starting point to get you thinking about what possibilities are out there.
SECURITY OPERATIONS
. Security Event Volume — Tracking the volume of incoming security events tells management a lot about the state of the environment, the load on the security team, and the effectiveness of security controls.
. . . False Positive Reporting Rate (FPRR) — All security tools produce a certain amount of false positives, or alerts that turn out to not be problems. You can’t tune the alerting if you can’t properly measure the rate and type of false positive events.
. . . Number of Attacks Detected — Knowing the total volume of events helps determine the load the security tools and team are under. It is useful to be able to break this down by event source, such as IDS alerts over time or AV detections over time. This is an important metric for showing that a new control has had an effect.
. . . Number of Attacks Blocked — Knowing the block volume helps determine the load blocking devices are under, if they are performing well, and what additional tuning they need.
. Incident Response Volume — Tracking the volume of events you are responding to is vital for showing the load the team is under. This is the primary statistic that will be used to justify your staffing numbers. It is helpful to show this information in different ways, in order to highlight different aspects of the activity.
. . . By status — Showing how many new cases were opened vs how many were recently closed is a primary indicator of how much work is getting done. It’s important to caveat this number, though, as some incidents will close very quickly with minimal effort while other incidents may take weeks or more to close.
. . . By category — It is important to track incidents by category, such as Malware Outbreak vs Active Breach vs PII leakage and so on. This allows for more granular tracking of trends that focus on specific types of problems. For instance, it is easier to prove that new AV you just installed is improving the situation if you can isolate the number of malware incidents before and after the switch without having to see all the other types of incidents. I generally recommend using US-CERT’s Incident Categories as the starting point, and then customizing to your org.
. . . By detection — Noting how the SOC identified the incident is a helpful measure of which detection mechanisms are the most effective. Keeping track of the number and types of incidents users report helps indicate whether the user awareness training is being effective. And, tracking whether incidents are initiated by AV, IDS, Firewall, or something else will help you figure out which controls are providing the most return on investment.
. . . By business unit — Inevitably, certain portions of the enterprise will inherently be more secure than others due to localized policies, practices, cultures, and so on. Tracking the incidents by office, division, or some other logical breakdown that makes sense for your organization will identify which groups need additional training or resources.
. . . By geography — Similarly, tracking incidents by geographic location is a helpful way to identify hot spots and to break bigger problems down into smaller, more manageable chunks.
. . . By cost — One of a CISO’s primary duties is to track the financials associated with the security program and controls. This extends to also tracking the costs associated with each incident, which includes the labor costs to response and remediate for both the security team and others that were impacted. It is a lot easier to justify the spending on new security controls when you can show the financial impact of not having them.
. IR Team Effectiveness — As an extension of tracking the incident response volume, it is also good track these time-related statistics associated with different phases of an incident. Remember that ‘mean’ and ‘average’ are synonyms for the same number, but I tend to use ‘average’ in order to differentiate the acronym from the ‘median’. It is good to track both the average and median as they provide different views of the data. ‘Average’ is more inclusive of all the data, while ‘median’ is more tolerant of outliers.
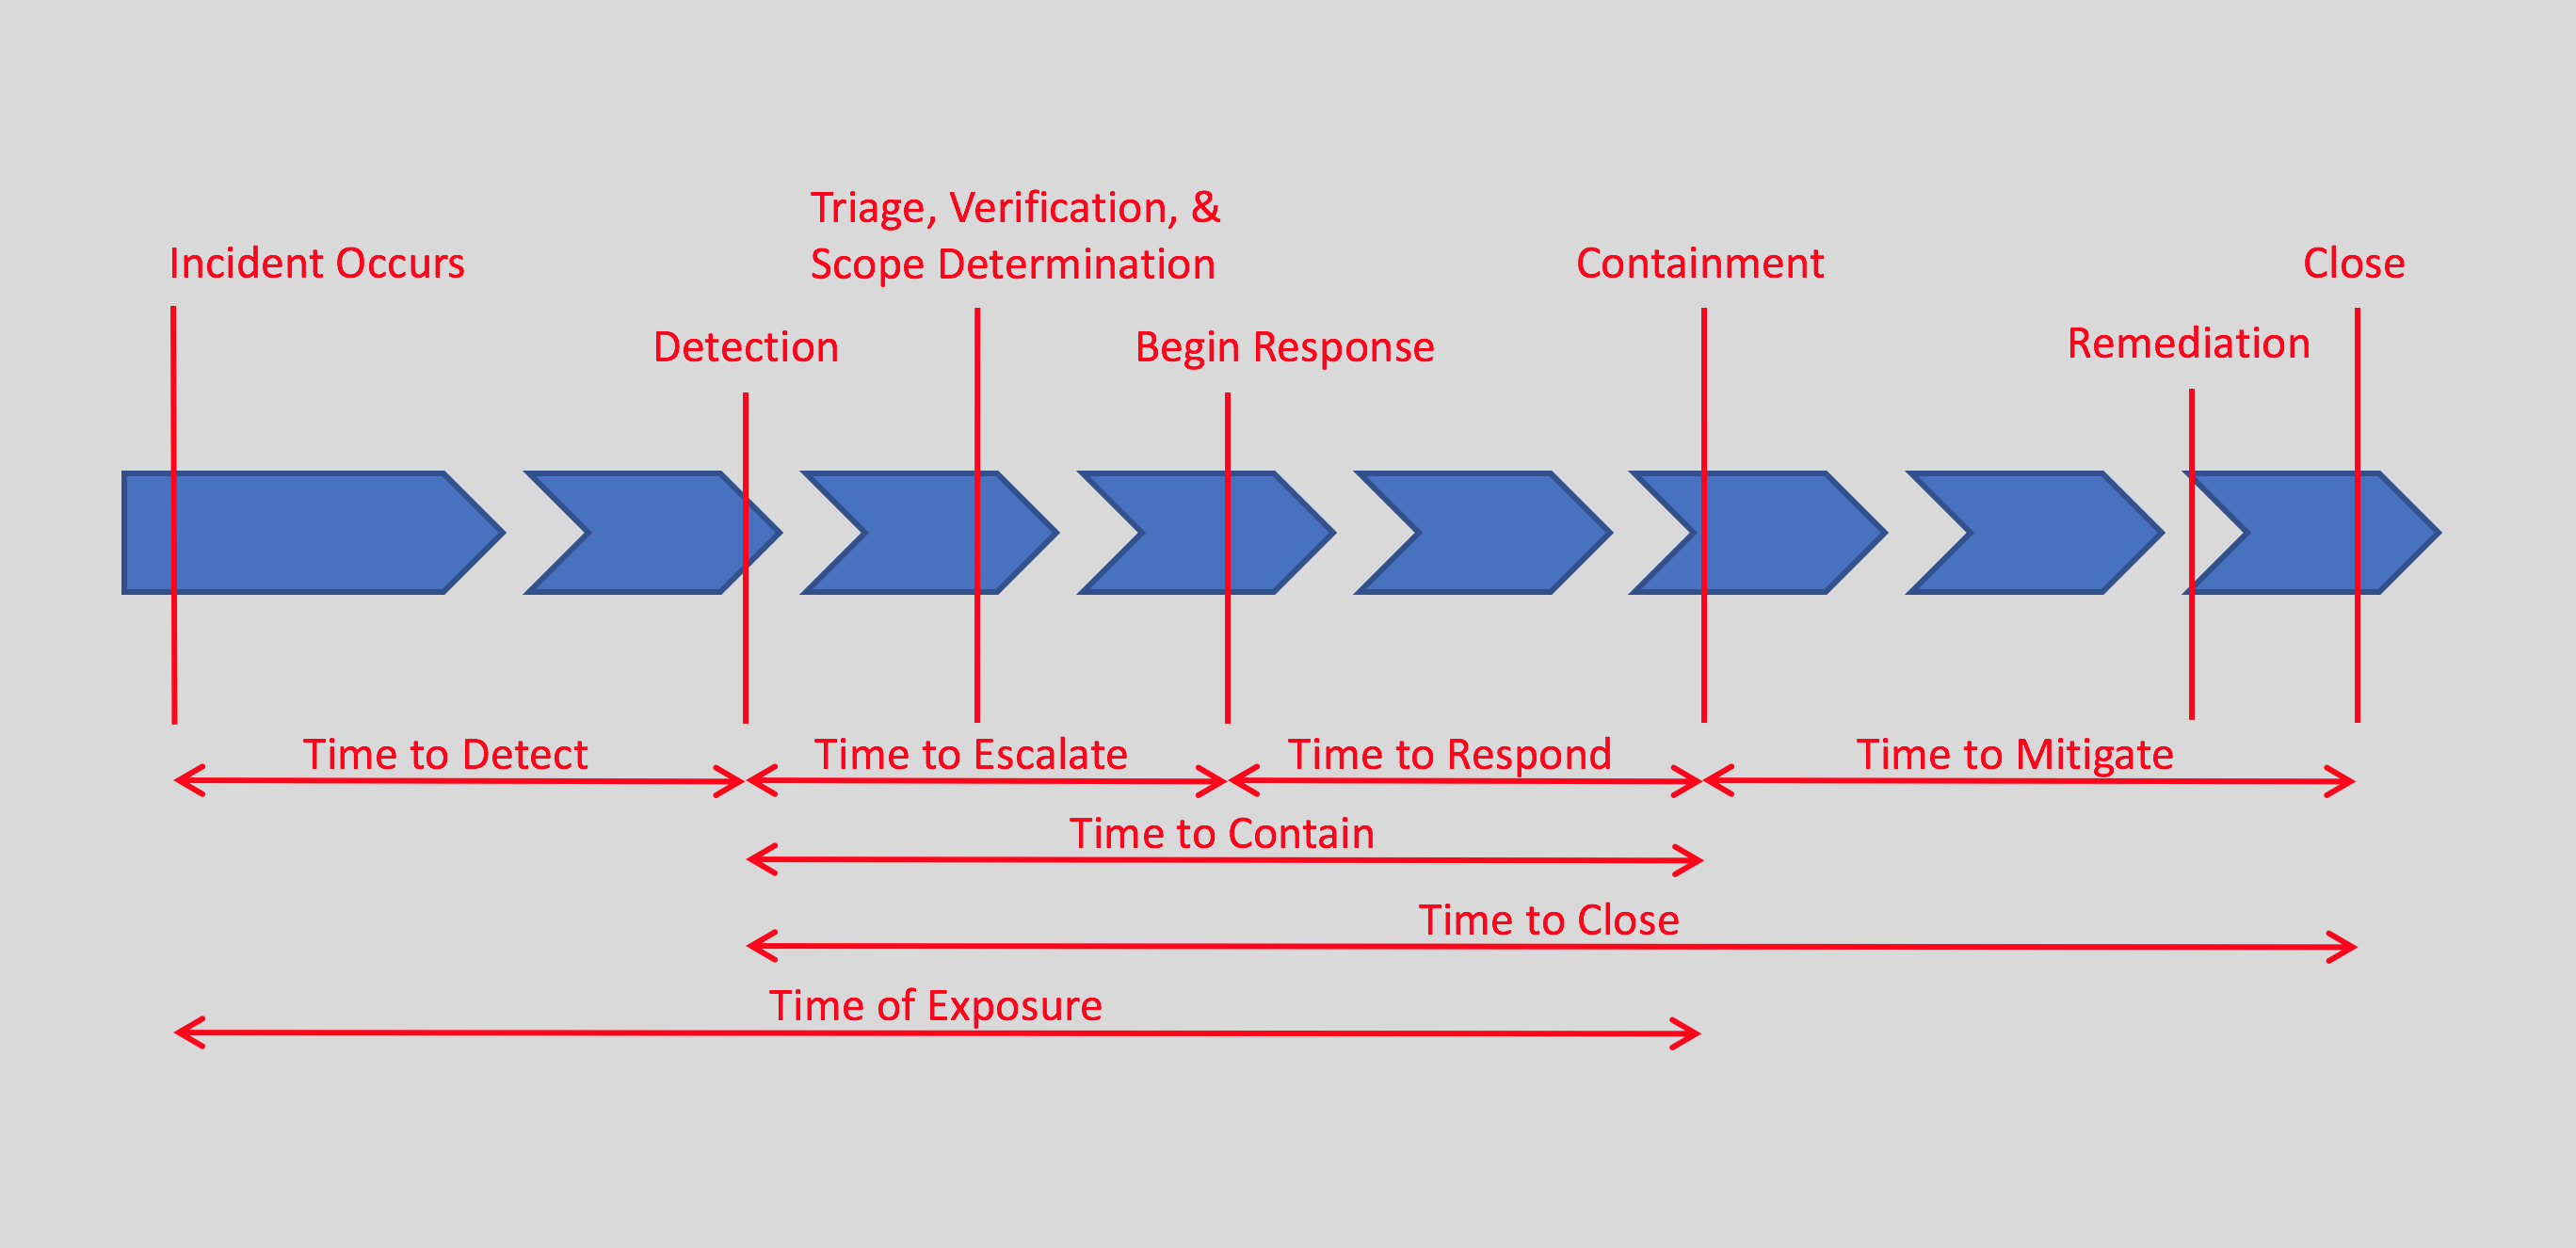
. . . Average/Median Time to Detect (ATTD/MTTD) — The time the incident occurred may not be immediately known, but hopefully will be learned during analysis phase of the response. This is an important metric to track as lowering the time here indicates the security team is getting better at locating and identifying problems. A few years ago multiple reports indicated this number was on average greater than 180 days, but recent reporting has indicated this is going down.
. . . Average/Median Time to Escalate (ATTE/MTTE) — This number indicates how long it takes for tier one to identify, verify, triage, and then hand the incident over to tier two.
. . . Average/Median Time to Respond (ATTR/MTTR) — This tracks the time tier two takes to understand the incident and then develop and implement a containment plan. There may still be additional clean up to do, but at this point the malware is no longer spreading, data is no longer being exfiltrated, or the attacker is no longer on the network.
. . . Average/Median Time to Mitigate (ATTM/MTTM) — This tracks the time the remainder of the cleanup, restoration of services, hardening of the network to prevent future similar attacks, event notifications, and other actions take.
. . . Average/Median Time to Contain (ATTCtn/MTTCtn) — This tracks the total time from detection to containment, which includes all actions in both tier one and two to get from initial alert to control of the incident.
. . . Average/Median Time to Close (ATTCls/MTTCls) — This tracks the total time from detection to final closure of the incident ticket, which includes all actions from detection through response to mitigation and final resolution.
. . . Average/Median Time of Exposure (ATOE/MTOE) — This tracks the time from when the incident initially occurred through detection and ending with containment. This tells management how long they were exposed to the threat. For instance, this could be the total time the ransomware was on systems from initial infection until it was rendered unable to further encrypt any more files.
. . . Average/Median Time to Notification (ATTN/MTTN) — Depending on the industry you are in or the type of incident, there might be one or more notifications that must be made as part of the incident. Often these notifications must occur within specific time frames set by law, regulation, compliance body, or policy, so tracking this helps show compliance and responsiveness.
There are dozens of way to slice this process up to be more or less granular. These are by no means the only times to track. This is just to give you a starting point from which you can customize to meet your org’s needs. Having the SOC and IR team operate out of a ticketing system makes it much easier to collect, track, and report the time these phase lines get crossed.
. Spam Volume — Emails with either nefarious links or attachments is one of the most common attack vectors. It is vital to keep a close eye on the spam coming into your environment.
. . . By total count — Track the total number of spam messages coming in each day, week, etc. in order to quantify the scale the spam problem the organization is facing.
. . . By percentage of total — To keep the volume in perspective, it is helpful to track the volume of spam per day compared to total emails per day. Stating that 12% of incoming email is spam provides management with more context than just providing the total message count.
. . . By block count — Track the number of messages getting blocked or quarantined by your spam filters. This is very useful for show effectiveness and return on investment in the spam filter. It is important to track the amount of spam that actually makes it into inboxes in order for this to be accurate.
. . . By block source — Track the blocks from automatic detection separately from user notifications in order to monitor the effectiveness of both the spam filters and user education in spam identification.
. Network Volume — Stats on network traffic are something that should be tracked for network health and maintenance reasons as much as for security knowledge. For security, monitoring the flow of traffic can be a key indicator of scanning, lateral movement, exfiltration, and many other attacker actions.
. . . By bytes — Being able to identify large transfers can be an indicator of your intellectual property leaving the network. It is important to build a baseline and then monitor for deviations.
. . . By sessions — Identifying a station that is generating a larger than normal number of network sessions can be indicator of an attacker scanning your network to identify compromisable hosts.
. . . By link — Especially in really large enterprises, it can be overwhelming to track each individual session or endpoint. It can be very helpful to monitor links in aggregate, such as monitoring the bandwidth used by each branch office. Then, when an anomaly is observed, the security team can zoom in on that link to discover the specific endpoint(s) responsible.
. . . By protocol — Tracking the protocols in use on your network is a vital data point for understanding your environment. This allows for identification of unusual or out-of-place protocols. For instance, if IRC is not a normal for your environment, finding IRC traffic may be an indicator of malware command and control.
. . . By source/destination IP — Identifying focal points for incoming or outbound network traffic can help identify sources of malicious activity, additional infected hosts, or otherwise suspicious traffic patterns.
VULNERABILITIES
. Percentage of Systems scanned — Vulnerability scanning should take place regularly. The higher the frequency of the scanning, the quicker new problems can be identified and thus remediated. Industry recommendations range from daily to weekly to monthly. It’s important for leadership to know the coverage the scans in order to place scan results in the proper context. This hinges on knowing the total number of devices in the enterprise from a source other than the vulnerability scanner. The goal should be to get as close to 100% coverage as possible.
. Vulnerability Volume — Stats on the number of vulnerabilities found are a primary driver to identifying risks in the enterprise. These stats should be presented in a variety of ways in order to highlight different meanings in the data in order to answer different questions.
. . . By type — Tracking the types of vulnerabilities enables more granular tracking of vulnerabilities over time, making it easier to associate vulnerabilities to incidents. If you need help deciding on categories to use, Carnegie Mellon has some suggestions.
. . . By severity — Categorizing the severity of the vulnerabilities is vital for differentiating critical problems from those that impose a low risk. It is important to adjust the severity level provided by the scanning tool based on the business impact of the system with the vulnerability. A medium risk vulnerability on an internal web server may be a high-risk vulnerability on an Internet-facing web server in the DMZ.
. . . By age — Critical vulnerabilities should be addressed more quickly than others, so it is important to track each severity category separately in order to prioritize the remediation work load. Knowing how long the vulnerability has been present in the enterprise is vital for tracking risk exposure and for measuring remediation effectiveness.
. Patching — Applying patches and updates promptly has been shown time and time again to prevent incidents.
. . . Average time to patch (ATTP) / Median time to patch (MTTP) — Tracking the time to apply of patches is a primary indicator of the risk exposure level of the enterprise and an indicator of how well the enterprise is being maintained.
. . . Number and percentage of unpatched systems — Any systems missing security patches present a risk to the enterprise. Knowing the number and percentage of unmatched systems tells management the risk exposure and attack surface of potential incidents.
. . . Number and percentage of missing patches — In addition to tracking missing patches by system, tracking them by patch helps identify which patches are problematic.
. Policy Issues — A vital part of a governance and compliance program is managing policy compliance issues throughout the enterprise.
. Number and Percentage of Security Exceptions — There are always going to exceptions to most policies, but they should be kept to a minimum. The only way to know if they being kept to a minimum is to measure the exceptions and periodically reassess their necessity. Many security exceptions directly result in an increase in attack surface and risk exposure, such as the number of users with local administrator privileges, systems to remain unpatched, or systems or users not applying any other standard security control in use everywhere else across the enterprise. Bad guys only need one way in, so any security exception should be kept to a minimum and other mitigating controls should be applied.
. Defense Coverage — It is important for management to know positively the coverage of various defensive tools. Knowing the number of percentage of systems not running anti-malware or other endpoint detection and response agents is important. Knowing which segments of the network are not monitored by firewalls, intrusion detection systems, or other network monitoring and defense appliances is vital.
. Hardware and Software Inventory — The importance of knowing your environment cannot be understated. You cannot secure what you do not know. Many of the other metrics above are meaningless without the context of knowing the total number and disposition of systems on the network.
. . . Number of systems — An inventory of the devices in the enterprise provides the basic starting point for knowing the enterprise. The information in this inventory is vital during incident response, vulnerability scanning, patch management, and basically everything else that needs managed on the enterprise.
. . . Installed software — An inventory of installed software by version number provides the basis for tracking everything from licensing compliance to patch management. It is important to track all installed software and not just the operating system, as many other installed applications, such as Flash or Java, present attack surface that must be accounted for.
PROJECTS
. Project Volume — In addition to the ongoing, daily operations, security programs also take on various short- and long-term projects that need tracked. These projects could relate to, for example, equipment deployments or upgrades, security controls effectiveness or gap analysis, or any other tasks that non-recurring or not intended to be ongoing operations. Since these tasks consume resources that need to be accounted for, it is important to track how many of these projects there are and what resources, in the form of both time and money, they are consuming.
. . . By status — Tracking the status of the projects, planned vs in progress vs completed, provides and indicator of the amount of projects underway at any given time. Showing that projects are closing gives upper management the impression that work is getting done and, hopefully, shows return on security investment.
. . . By age — Tracking how long each project has been underway provides a key indicator of the security program’s ability to complete projects. It is important to caveat this number, as some projects are short and simple and thus will close quickly, while other projects are long and complicated and thus will take longer to close – not all old projects are behind schedule. Keeping that in mind, it is important to track how long each project is taking.
. . . Burn rate (per project) — Each project consumes various resources, such as employee time and program budget, that need to be tracked in order to ensure the project is delivered on time and under budget.
. Percentage Completed On Time — Knowing which and how many projects are being completed on time could be indicator of blockages that need to be addressed.
. Percentage Completed Under Budget — Knowing which and how many projects are being completed under budget could be a indicator of fiscal responsibility of the program management.
. Total Budget Committed — Tracking the money spent so far is an important part of the financial responsibilities of the security program. This should be tracked per project and in aggregate across the whole security program.
. Total Budget Outstanding — Tracking the allocated budget still to be spent is important for tracking how well the program is spending their budget. For program management, it is vital to know how close to the end of the runway they are getting as the year progresses. This should be tracked for the program as a whole and on a per project basis.
TRAINING
Information assurance training for all users in the enterprise is a vital component of any organization’s security program. Having users sensitized to common threats, such as spam, phishing, business email fraud, ransomware, and all of the other evils common on the Internet, is incredibly important as users are often the first line of defense and first indicator of a problem for many types of incidents.
. Percentage of Users That Have Attended IA Training — Most organizations have a goal of getting every employee trained in information assurance. Measuring the number of trained personnel compared to the total number of users helps management measure how close to attaining this goal they are.
. Percentage of Users That Failed Phish Exercises — Many organizations conduct regular phishing exercises. When executed properly, these can provide an excellent training opportunity to the user base. Tracking how users respond to the fake phishing emails, be it by clicking on the links, deleting the email, reporting the email as spam, or notifying the security team, is an important measure of the effectiveness of the IA training, the security incident reporting procedures, and the security awareness of the users.
. Percentage of Users That Correctly Answer Security Polls — Another great way to measure the security awareness of the user base is to post or email short polls or questionnaires on information awareness topics. Analysis of the responses can be an effective way to measure the security knowledge of the users.